How we measure performance
Measuring impact is a global challenge in the marketing analytics industry. Applying a new marketing strategy always goes hand in hand with measuring the success of it. Marketers are tasked with the development of an effective experimentation design to unravel the true impact of their marketing interventions. The gold standard methodology is by evaluating the results of a randomized controlled experiment where they compare audiences exposed (test) to the marketing interventions versus the ones not exposed (control). It is considered gold standard as by implementing such a comparison, one can derive cause-effect relationship in a more conclusive manner. More often than not though marketers are not in a position to implement such a direct comparison. The alternative to such a methodology is to implement techniques based on observational data, meaning these events have already happened without any control, hence, the selection of these audiences is not random. This fact generates major challenges in the conclusiveness of results because the selection in observational data areis not randomized.
Another key item in the creation of a measurement solution is that marketers should clearly define goals and KPIs as these are the foundation of any measurement evaluation approach. When testing or applying a marketing intervention, the business goals should guide all strategic decisions. In addition, at the beginning of the measurement journey, it is important to assess the data sources, the quality of the data that they enable and the available methodologies.
Choosing the right methodology
Understanding the types of data sources and data available is foundational to choosing an appropriate measurement methodology. There exist different methodologies that can be used to measure impact and unfortunately there is no holy grail when it comes to consistent full accuracy. Literature shows us that there are certain limitations that come together with each of the methodologies. Fortunately, there exist tools to be able to understand more around those caveats.
Incrementality: proving cause and effect
The process of estimating the true effect of an intervention (for example a pricing strategy) on an outcome (for example purchases) is known as “causal inference”. And common effectiveness measurement methods do not always get it right. Rather than abandoning these trusted methods altogether, marketers can adopt a hierarchy of evidence that favours methods higher up the hierarchy. Where it is not possible to employ the gold standard, marketers should be aware of the limitations of their research and the uncertainty attached to their results. But experts should take care over how and when they communicate uncertainty, so that it does not hinder decision-making.
The main 2 challenges in this area that have to be communicated before the implementation and consequently the measurement of a program:
- Communicating uncertainty: Regardless of the measurement method (even the gold standard, the randomized controlled experiment is not flawless) we need to acknowledge and understand the basic assumptions present the error margins present in estimates of program effectiveness.
- Correlation does not imply causation: Observational data vs. The Gold Standard: Randomized controlled experiment – Moving from observation to causal inference is a challenging task.
① The Gold Standard: real-time, randomized controlled experiments
Randomized controlled experiments test a hypothesis by introducing a treatment, studying the effects, and determining the impact of the marketing treatment. The implementation is the following: Designate a group (or groups) of people who will be exposed to the treatment, and a control group who will not. By isolating the exposure of a variable (e.g., a specific pricing strategy) and then comparing it to the control group, you can understand the true incremental value of the strategy. The quality of experiments may vary, but they are still the ideal and most accurate way to measure incrementality.
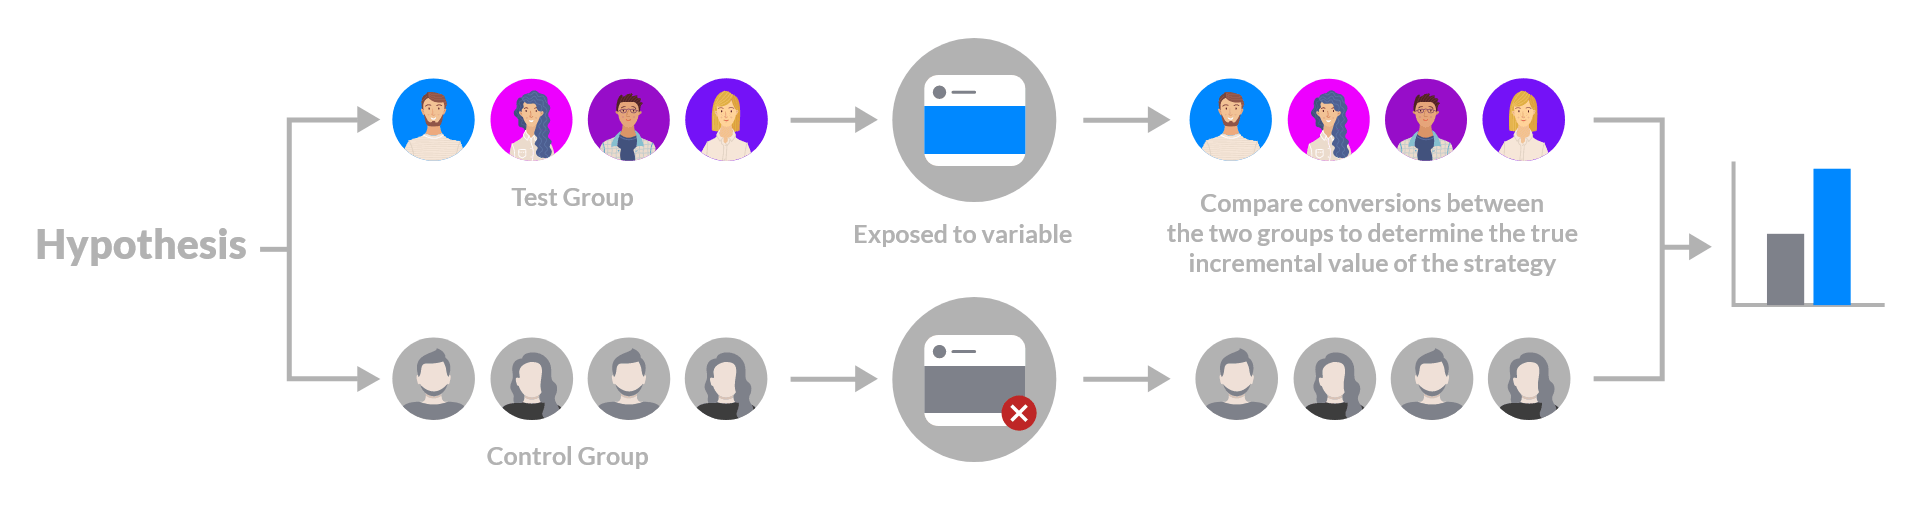
Despite their benefits, experiments do require up-front setup, as well as the opportunity cost of withholding treatment from the control group.
Although the “gold standard”, experiments are not a holy grail: Randomized assignment within a marketing experiment helps ensure that the groups are statistically similar. However, outliers can make comparisons problematic. Outliers can be defined as test participants who exhibit results that are well above or below the norm. Outliers can make two groups being tested dissimilar. It is true that outliers exist in all datasets, but their presence in a test can dramatically change how you evaluate a treatment. For smaller tests, the presence of an extremely large customer in one of the treatment or control groups can sway the results. Many businesses that operate on a freemium model, like gaming and some SaaS companies, are built around infrequent, large purchasers. Gaming companies often refer to these customers as whales, as they account for a much larger portion of revenue than the average player.
Experiments are preferred because you have a higher level of certainty that the results you are seeing represent the actions you are trying to measure. Nevertheless, it is important to proceed with caution and tackle the right way potential issues such as the presence of outliers: The selection of Median as a statistical measure or removing outliers entirely through exclusion are common solutions in research & industry.
② Observational Techniques
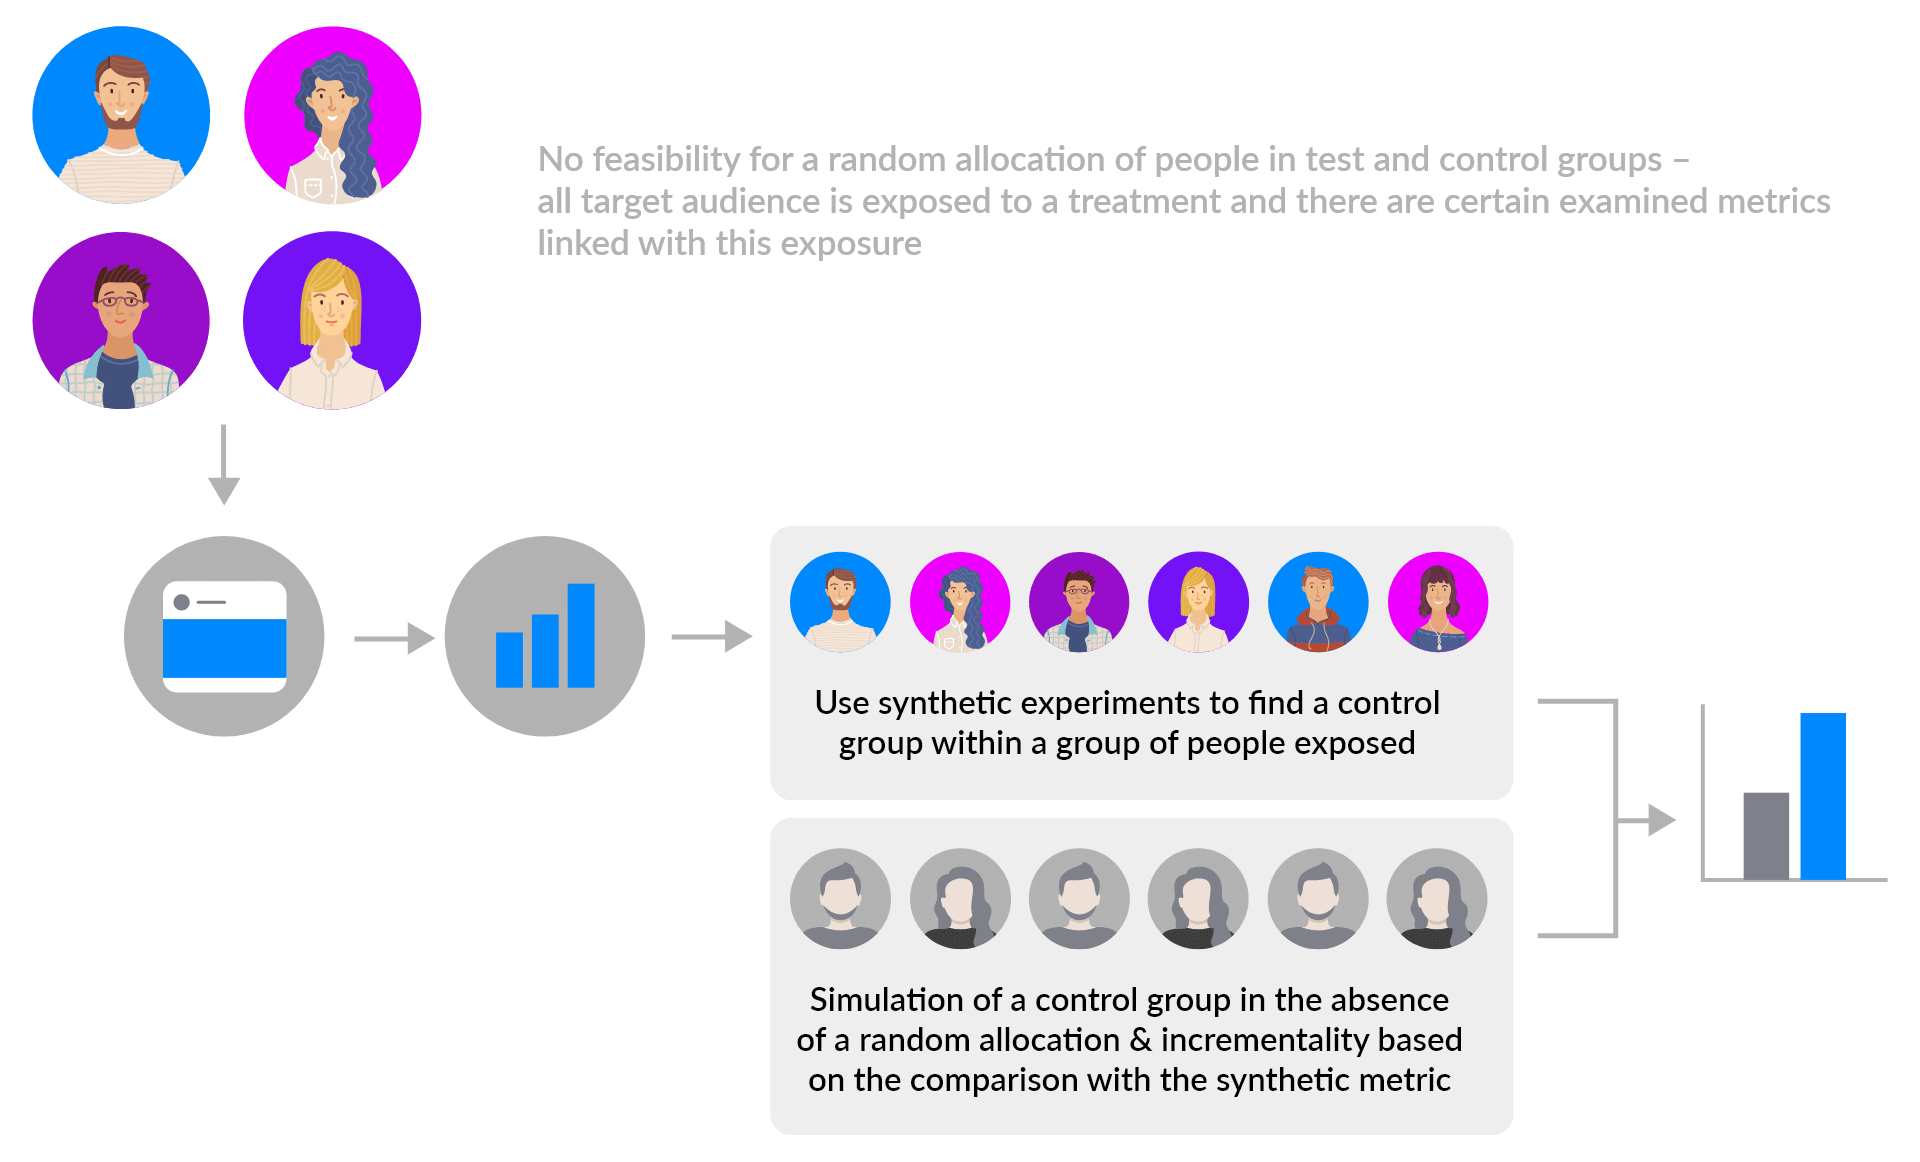
In the absence of a randomized controlled trial, there exist methodologies based on observational data. These techniques cannot yield with the same type of confidence proper estimations of causal effects but they remain the sole tool that marketers can leverage when they cannot run experiments. They rely on synthetic experiments and creation of benchmarks and counterfactual simulations by measuring what would have been the impact on the audience if treatment had not applied and then compare simulated performance without the treatments vs. actual performance with the treatment.
Striving for conclusive results
Driven by ever greater scrutiny on the bottom line, marketers and product managers will increasingly have to aim for the highest standard of evidence. They won’t always get there, so they should be pragmatic, aware of any potential uncertainty in estimates, and make decisions nevertheless. The good news is the things that can go wrong are often predictable, meaning marketers can plan for them.
It is hard to predict all the factors that should be the potential source of bias and isolate them, but industry experts know when there would be a possible contamination of results, e.g.:
- a broken flow or data pipeline
- a burst of new low value users coming from user acquisition efforts
- app being featured
- seasonality
- peculiar market conditions
- random events
- not having the right amount of data
- concurrent testing of multiple variables on specific cohorts
- people in the test and control group crossing paths
Some illustrative mechanisms to validate quality of measurement are the following:
- Ensure a hypothesis that isolates a single variable
- Gather enough data to accurately represent a test – check confidence levels / statistical significance / error margins and when that is not feasible, ensure that the sample size / volume of observations you are using is above a specified meaningful threshold
- Ensure stability of treatment assignment
- Ensure comparability between treatment and control cohorts (apples-to-apples comparison, e.g., comparing with the US market is not representative as there is quite different quality of players there, heavy advertising campaigns there)
- Ensure identification and exclusion of outliers and fake users
- Prefer Median as a statistical measure
How we measure performance of our Pricing programs
① Randomized controlled Experiments
The wappier SDK integration option makes the randomized controlled experiment technique feasible.
To assess Pricing Program Performance, we split the users between two groups:
- The Target Group that gets the wappier treatment (all the new prices for SKUs & Countries in scope).
- The Control Group that does not get the wappier treatment. All users there continue to see the regular prices and we use them for evaluation purposes.
Before the program’s official launch with the wappier optimization SDK, we decide on the desirable audience split between Target & Control Groups (e.g., 90% of the users get assigned to the Target Group and the remaining 10% of the users to the Control Group).
When users appear for the first time in our SDK, they get randomly assigned to one of the two groups (always based on the assignment percentage we’ll agree on). This is automatically done by our SDK and after our users get assigned to one of the two groups, they should never change group (a Target Group user should not be later on assigned to Control Group).
To provide you a holistic picture of the overall performance, we calculate and actively monitor multiple signals, both quantitative and qualitative.
Our main KPI is Average Revenue per User (ARPU), and we measure this on a per country level. The wappier pricing program does not affect (at least directly) the inflow of users, this is mainly driven by user acquisition campaigns. What it does increase is ARPU. Some of the auxiliary signals / lagging indicators: Revenue, Transactions, Player-to-payer Conversion.
Ensuring high-quality results
A first thing we are looking into is to ensure we have in each of the cohorts a monthly average higher or equal than 25 payers and a minimum of 22 payers per months. Regarding confidence levels, we use the industry-standard which is 95% . We have the ability to run the significance test per country and then use only the significant ones to calculate the overall confidence level as we should not just summarize the individual confidence levels and still claim that this is the overall 95% confidence level.
We are able to filter out noise and outliers using the following tactics:
- Filter out users who create noise but add no value. When used, the dataset only includes users (from both Control & Target Groups) that were active in the game for >1 days.
- Address implications of outliers in both groups that result in unequal revenue distribution. When the Revenue within a group, either control or the corresponding target, varies significantly, we can re-distribute the incremental spend evenly across the rest of the cohorts. This tactic though penalizes the affected group unfortunately, thus we have to proceed with caution here.
- Cohort Analysis by Country & Installation Dates: Address unequal attributes of users due to UA campaigns Cohort comparison of Control vs Target Group – grouped by country and cohorts by Installation Date. Daily buckets that contain Target Group users of the same country who installed the game the very same day compared only with the corresponding buckets of Control Group users.
② Playbook of Observational techniques - Counterfactual Simulations
The SDK-Less integration option cannot support a randomized controlled experiment technique as all of the players within a country will receive the same prices. To assess the performance of the program we have to rely on a playbook of observational techniques. We can only aim to reach the best estimates of our contribution to revenue uplift once our program kicks-in. To provide you a holistic picture of the overall performance, we calculate and actively monitor multiple signals, both quantitative and qualitative.
Our main KPI is Average Revenue per User (ARPU), and we measure this on a per country level. The wappier pricing program does not affect (at least directly) the inflow of users, this is mainly driven by user acquisition campaigns. What it does increase is ARPU. Some of the auxiliary signals / lagging indicators: Revenue, Transactions, Player-to-payer Conversion.
wappier Proprietary Benchmark methodologies
One way to measure results is by creating sort of benchmarks based on different kinds of control cohorts. Then we are comparing the relative ARPU growth of target cohorts (i.e., countries and/or platforms we optimized) versus the control ones.
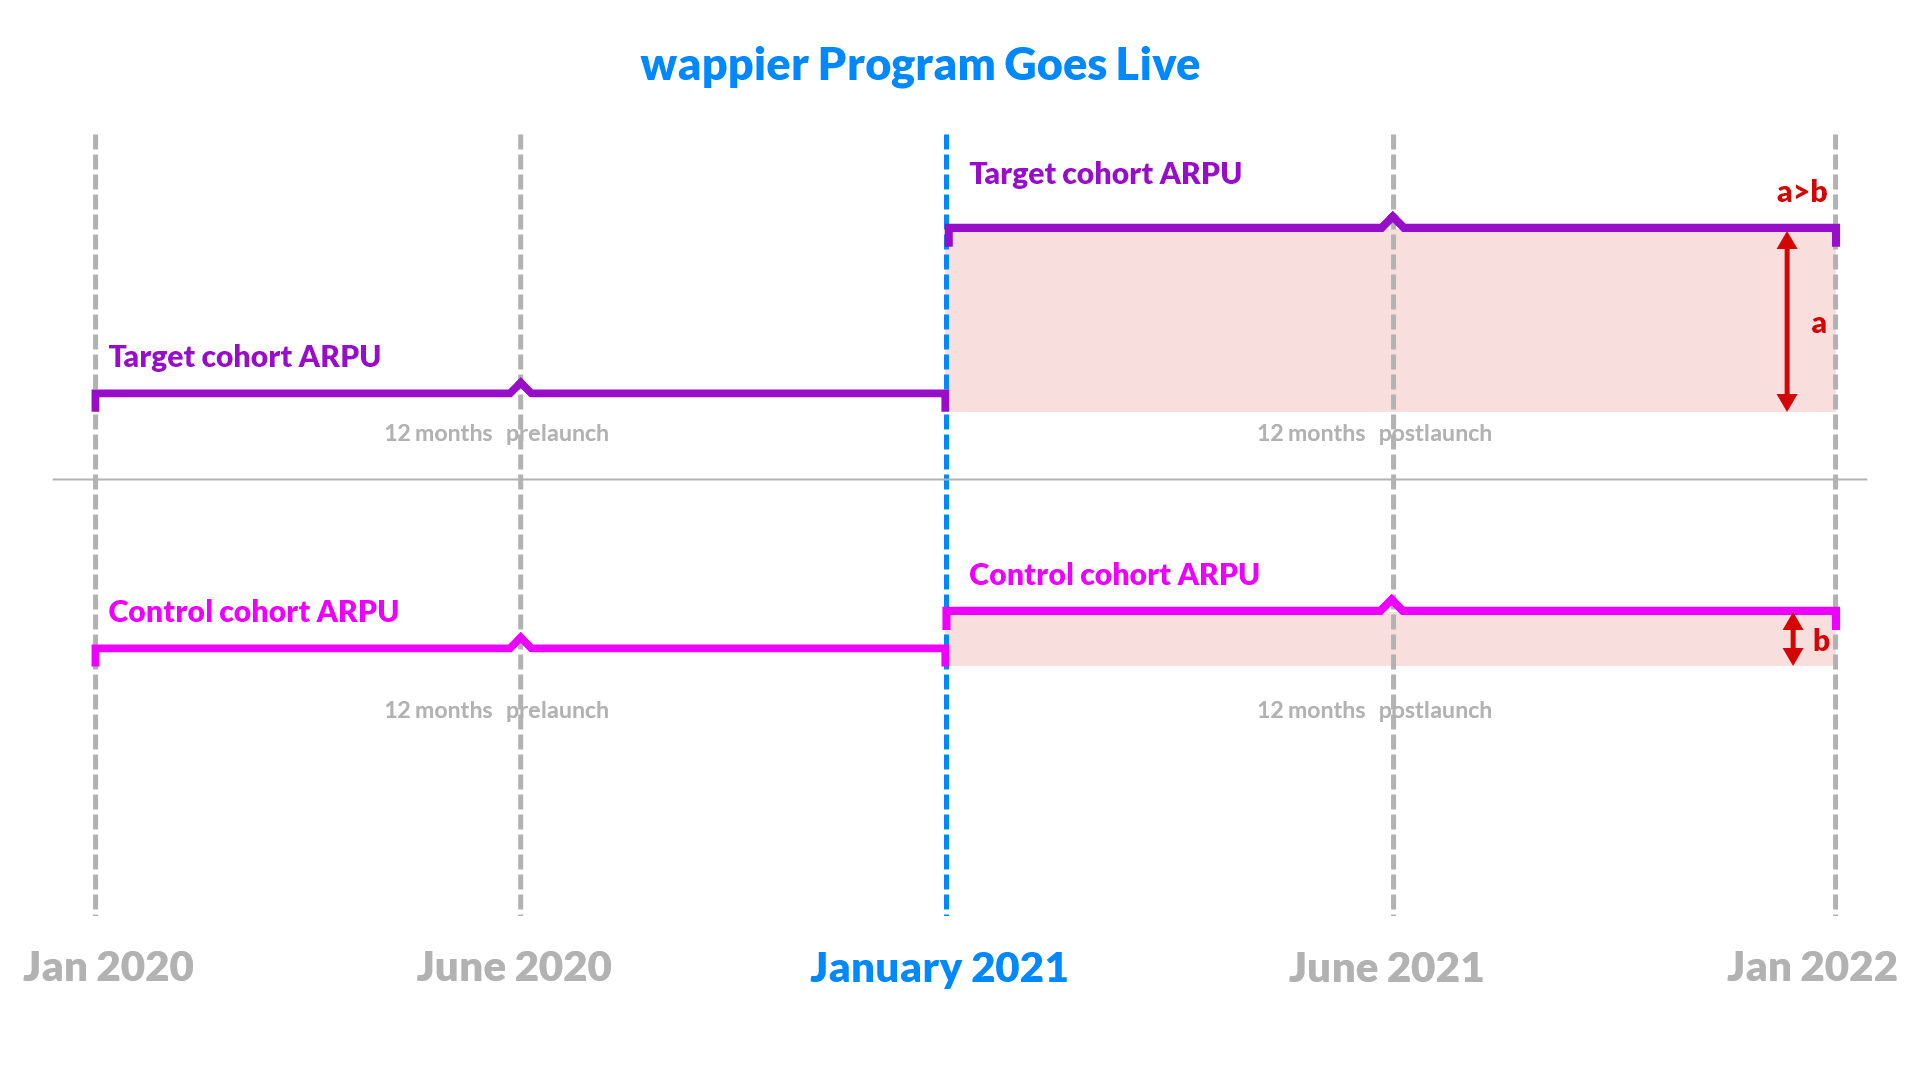
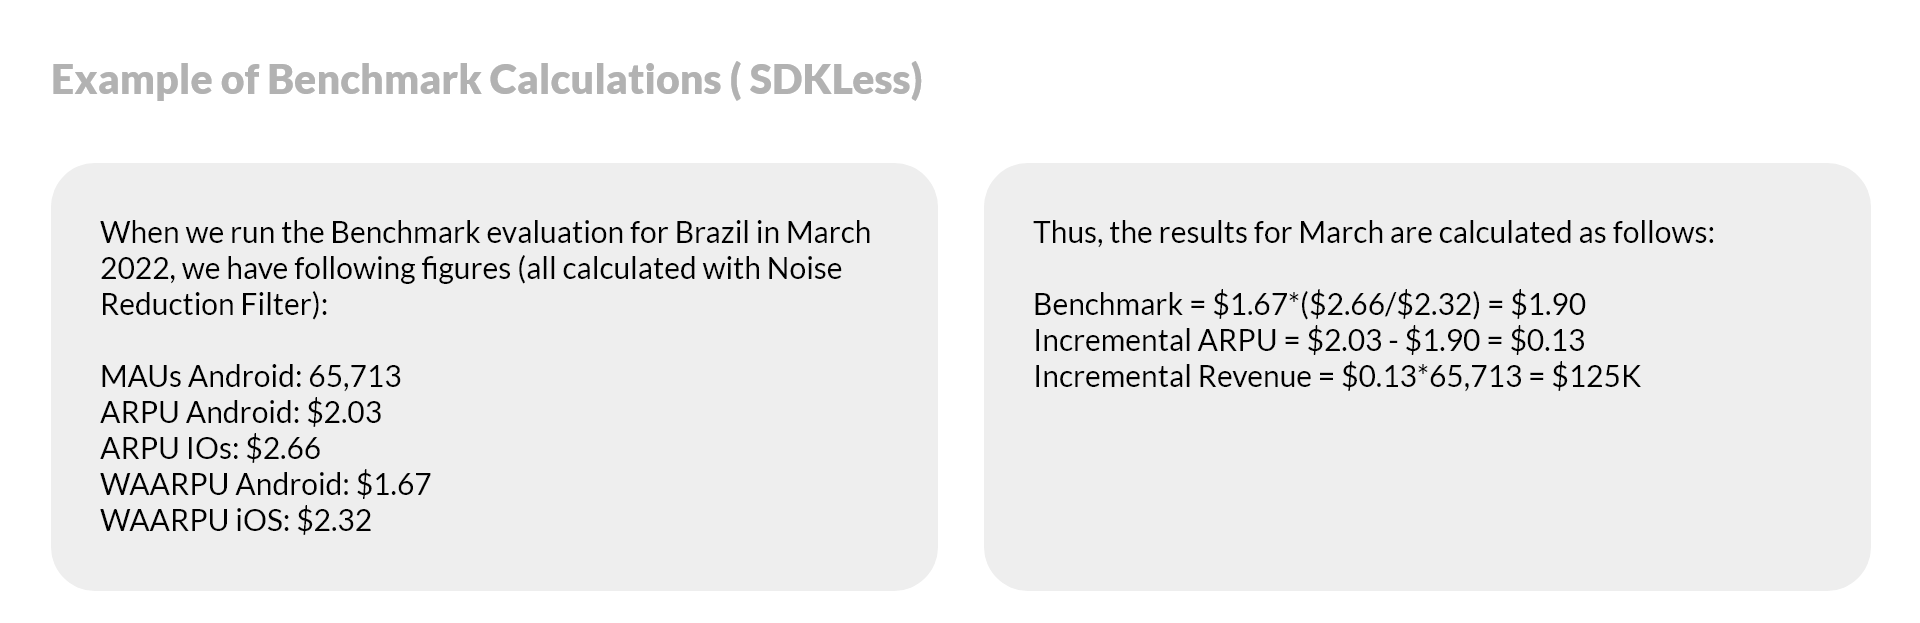
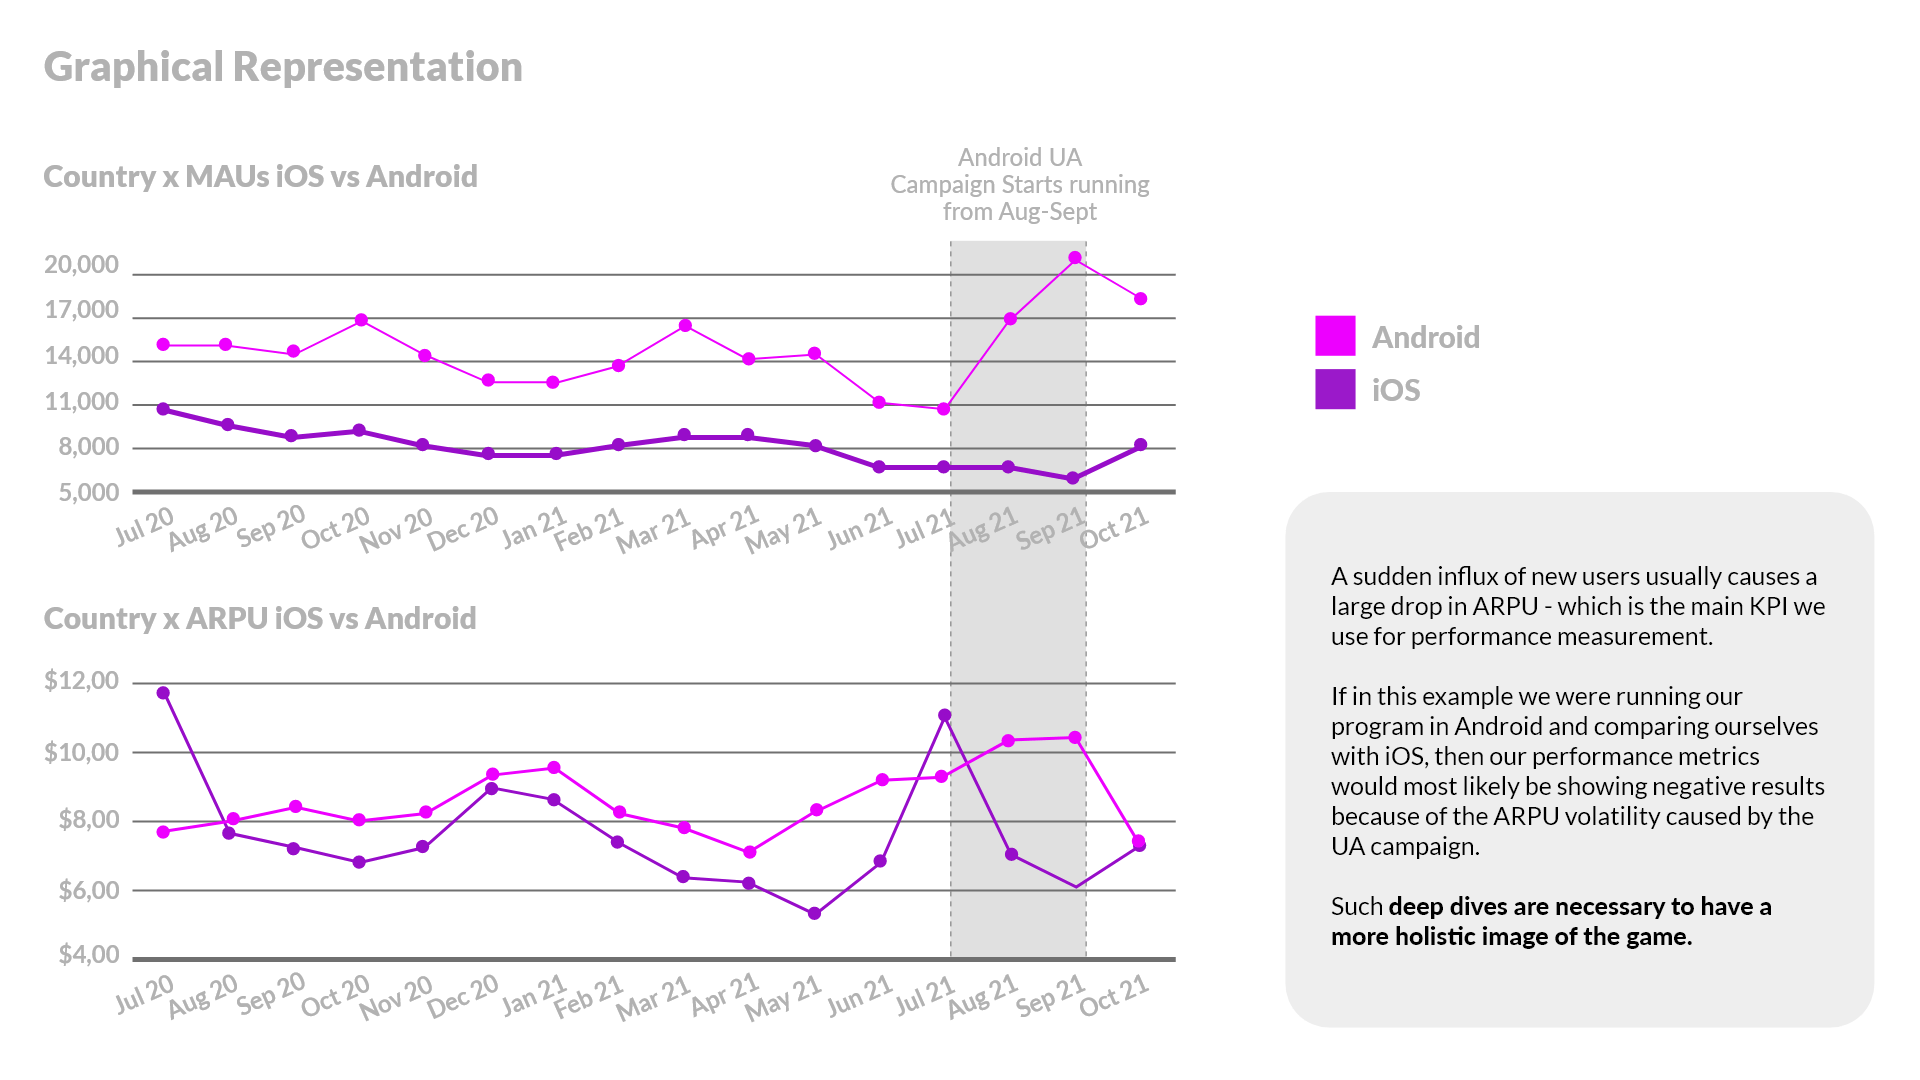
In order to best capture better seasonality & trends we want to compare the same countries in a “horizontal” manner. To this end, we leverage as Benchmark Control Group: the other Platform (e.g., Android cohorts versus iOS). We compare the relative ARPU growth between countries and platform we optimize against the same countries on the platform we do not optimize. We assume that any differences in the ARPU growth between the platforms is attributed to our program.
We calculate a counterfactual ARPU based on the performance of the control cohort (e.g. , performance of the app in iOS, meaning the other platform or a “typical” country for which monthly ARPU figures are calculated as the median of various control countries' ones) in order to have an estimation of the ARPU that the target cohort (e.g. Android) would have had, if we had not changed the prices.
We compare each scope country on Android against the same country on iOS, by following these steps:
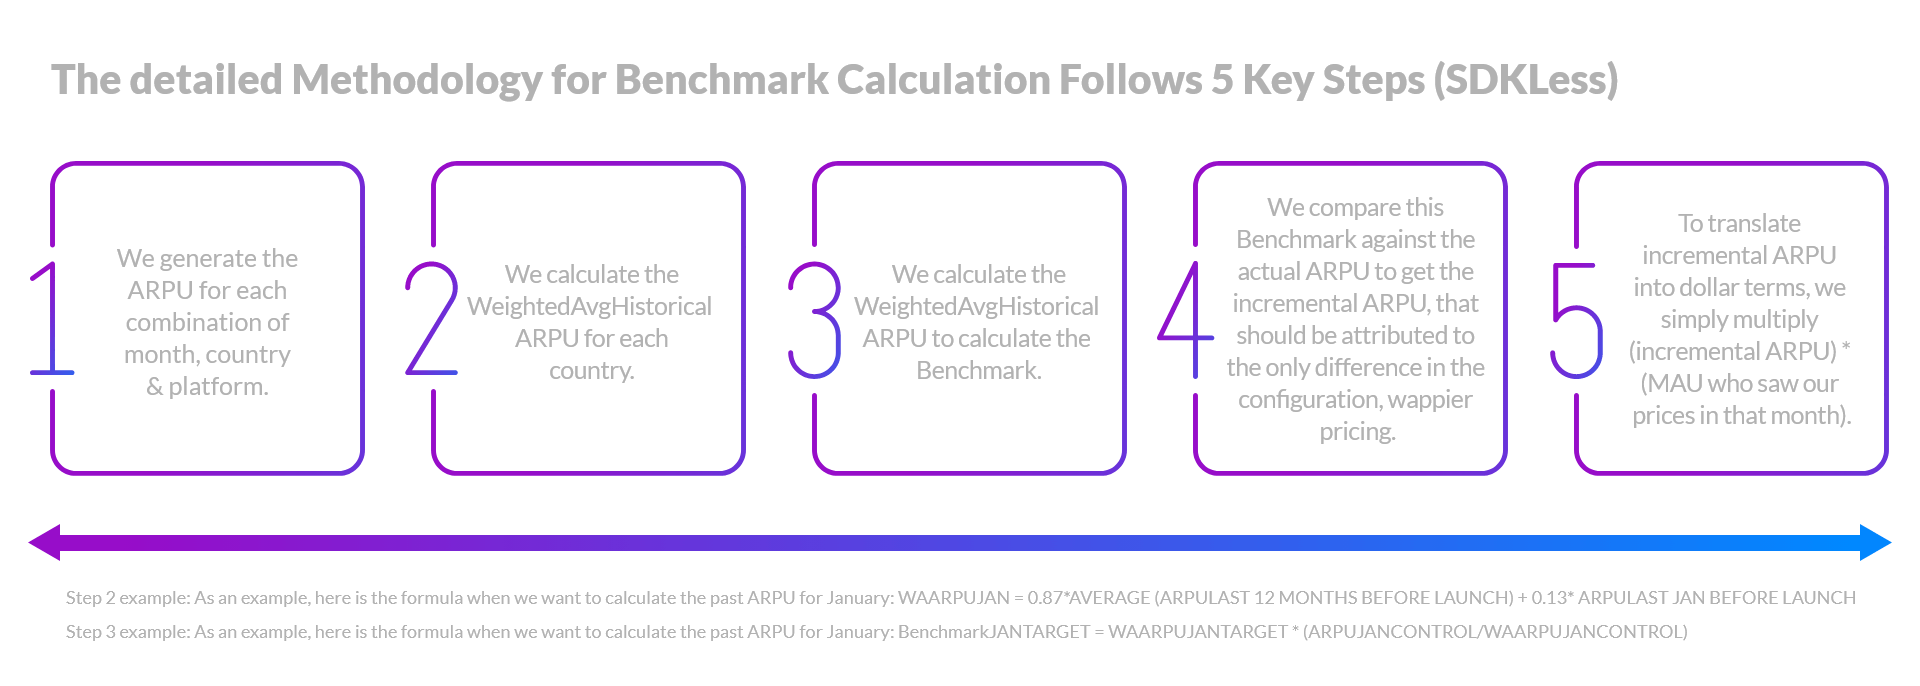
① We generate the ARPU for each combination of month, country & platform
② We calculate the Weighted Average Historical ARPU for each country
This is calculated by taking the Average ARPU of the 12 months before the start of the pricing program while giving an extra weight to the corresponding past month.
For example, here is the calculation for September:
WAARPUsep = 0.87AVERAGE(ARPU last 12 months before launch) + 0.13ARPU last sep before launch
The weight values are indicative and are being used to capture mean performance as well as seasonality. For the second term, which captures seasonality, different values could be applied, e.g., December is linked to the highly important seasonality of Xmas period.
③ We use the Weighted Average Historical ARPU to calculate the Benchmark.
The hypothesis here is that the growth in android would be the same with the one in iOS if we had not changed the prices.
For example, here is the calculation for September:
BENCHMARKsep = WeightedAvgHistoricalARPUand-sep * (ARPUios-sep / WeightedAvgHistoricalARPUios-sep)
④ We compare this Benchmark against the actual ARPU to get the incremental ARPU, that should be attributed to the only difference in the configuration, wappier pricing.
⑤ To translate incremental ARPU into dollar terms, we simply multiply (incremental ARPU) * (MAU who saw our prices in that month).
Reminder that we apply at the beginning as a pre-processing step the NRF filter: i.e., noise reduction filter where we exclude users who were active only 1 day in the app, namely users who never returned after installing the app. This is a lifetime flag, changes as time goes by and a user is becoming again active, so changes results retrospectively.
This method is affected if changes occur in the respective countries in the control platform (i.e., targeted UA in a control country or price changes) or if major relative differences in platform monetization occur. This method also is only applicable when pricing one of the platforms (either Android or iOS).
To tackle the above issues we employ the Benchmark Control Group: Country Set. We compare the relative ARPU growth between countries we optimize against a group of countries within the same platform that we do not touch. We assume that any differences between the target countries’ ARPU growth and the ARPU growth of the control is attributed to our program.
The constraints of this approach are that there exists a probability of not fully capturing of seasonality & trends since comparing with different countries. It can also be affected if changes occur in the respective countries in the control group (i.e., targeted UA in a control country or price changes.
Causal Impact by Google
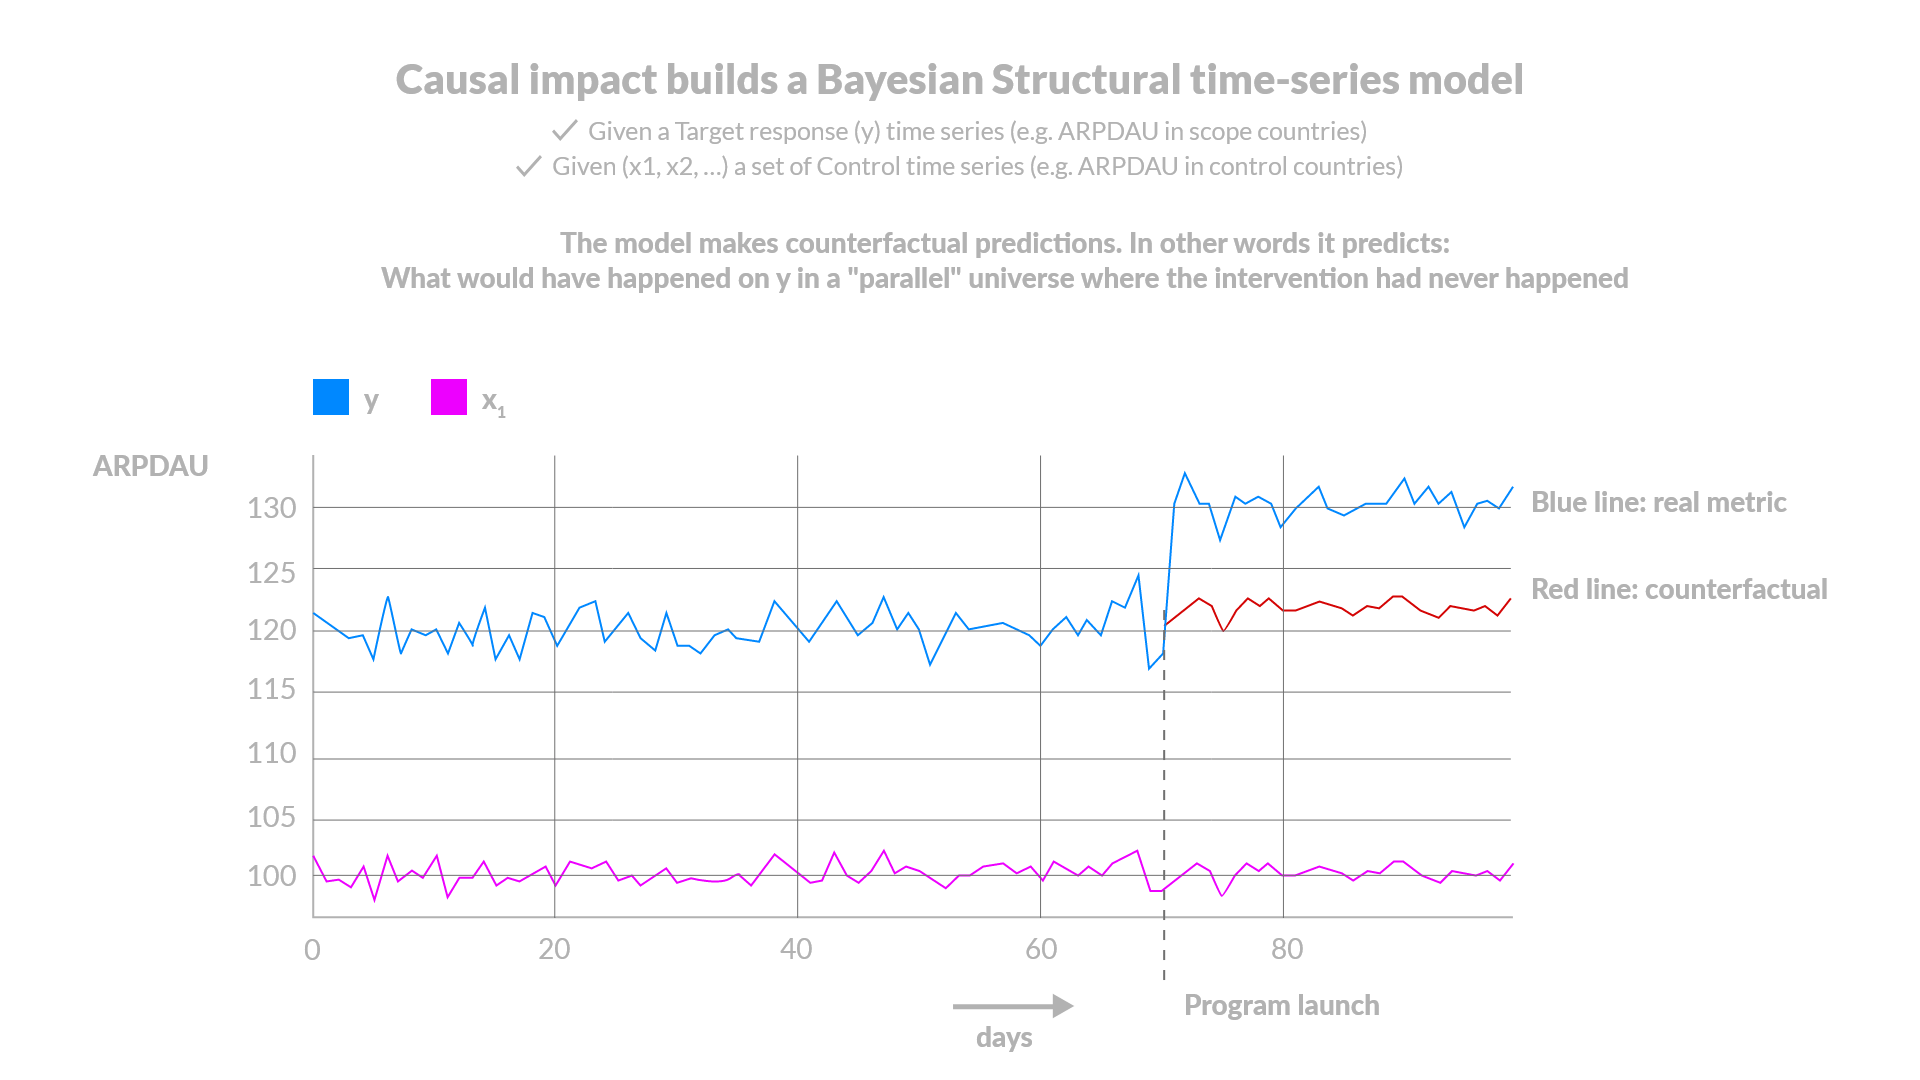
When we want to have more evidence regarding our impact, we employ Causal Impact, a Bayesian structural model by Google. Causal impact was first introduced by Google to estimate the effect each advertising campaign has to the overall sales uplift. We refrain from training causal impact with ARPU as the variable, because we have only 12 observations, which are too few., which leaves us with the option of inserting ARPDAU as training data.
Causal Impact (Predictor: Platform)
We use Google’s Causal Impact to check if there was any significant impact in the countries of one platform, given the performance of the same countries on the other platform. We assume that any differences between the actual ARPDAU and the one predicted by the trained model is attributed to an intervention. Model uncovers the relationship between ARPDAU of target platform and ARPDAU of control platform. Model captures even better seasonality & trend since comparing with same countries. Issues: Noise by using ARPDAU. Only applicable when pricing one of the platforms (either Android or iOS) . If used explicitly for performance evaluation purposes – affected by changes occurring in the respective countries in the control platform (i.e., targeted UA in a control country or price changes)
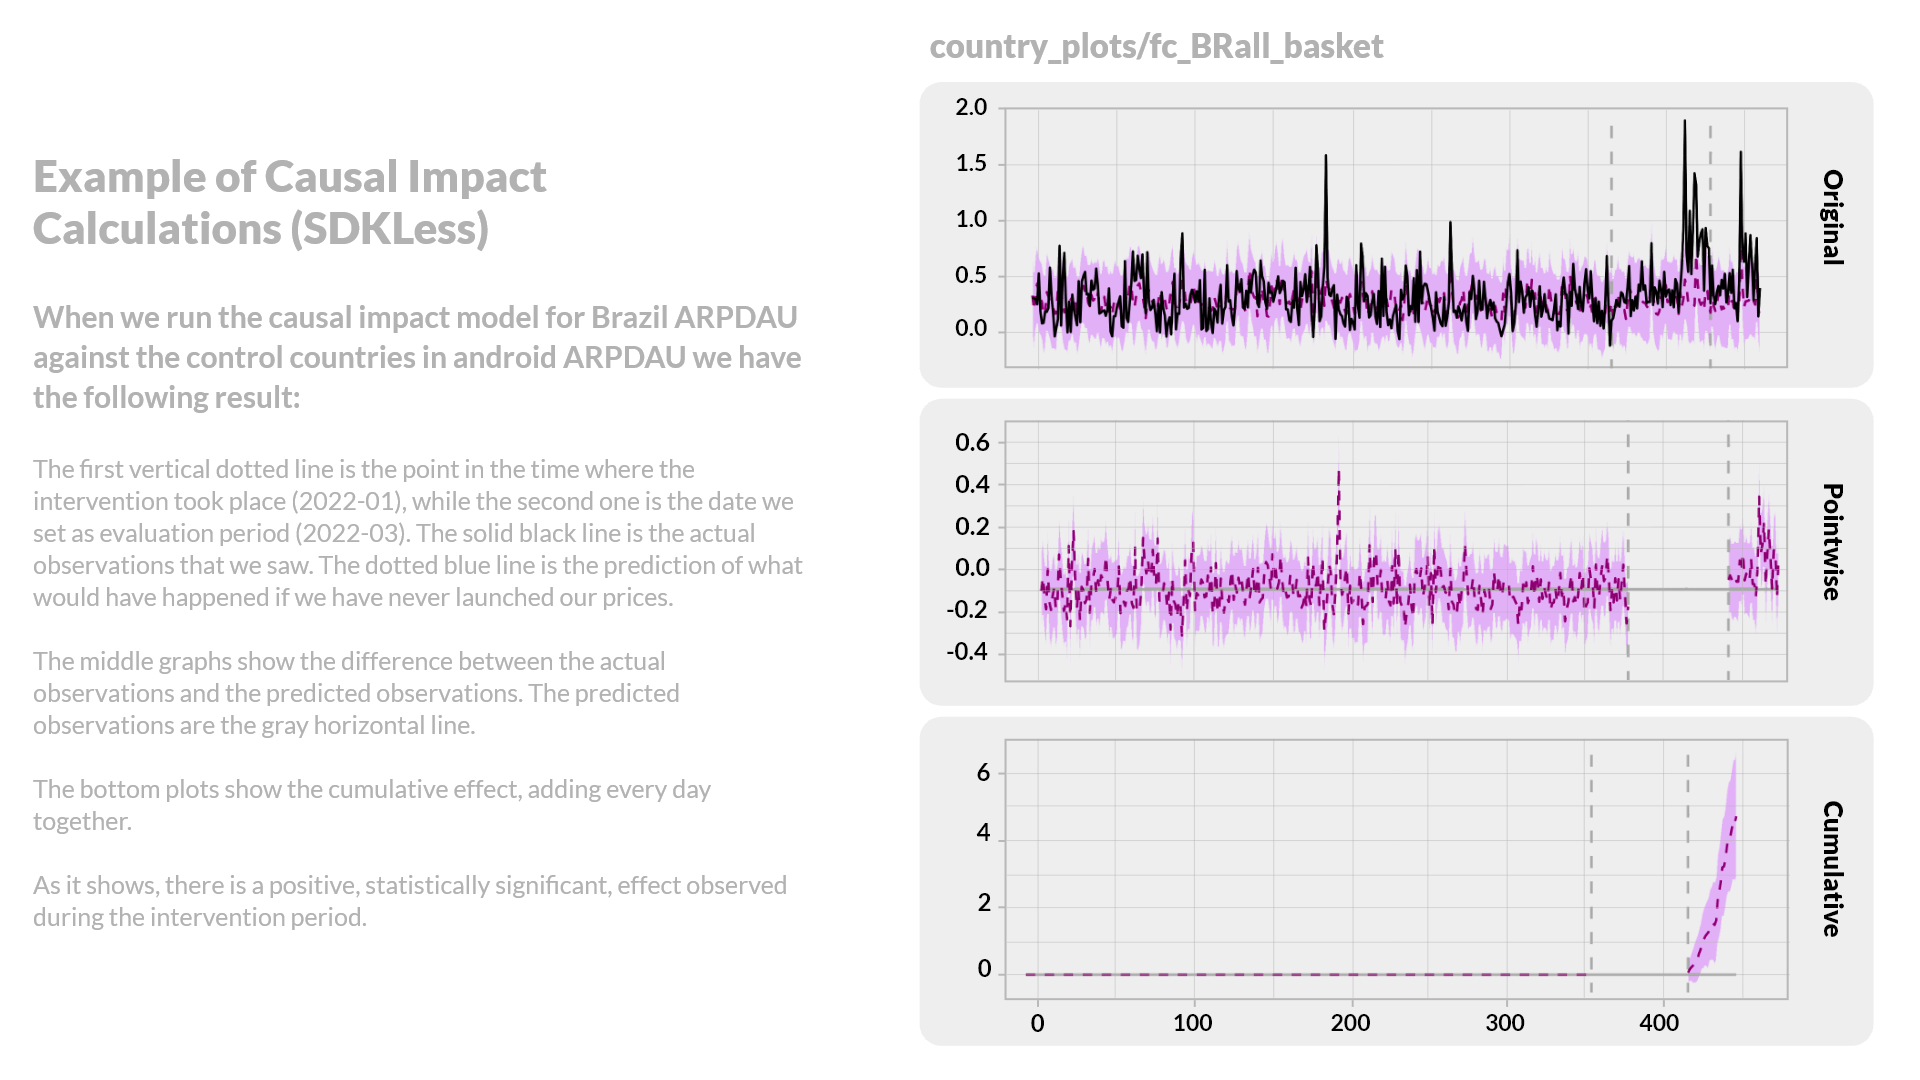
Causal Impact (Predictor: Stable Countries)
We use Google’s Causal Impact to check if there was any significant impact in a group of countries of one platform given the performance of a different group of countries within the same platform that did not present any significant impact. We assume that any differences between the actual ARPDAU and the one predicted by the trained model is attributed to an intervention. This is applicable when optimizing both (android/iOS) platforms. Clearly identifies if changes occur in some countries of control group. Issues: Noise by using ARPDAU. Probability of a not full capture of seasonality & trend since comparing with different country. If used explicitly for performance evaluation purposes – affected by changes occurring in all respective countries in the control group (i.e., targeted UA in a control country or price changes)
For these reasons, we do not use it as a main method to evaluate the impact of our program. While it cannot be used to evaluate the impact of the program, Causal Impact is a great tool to capture intervention in cohorts that we do not optimize. Both implementations of Causal Impact allow us to identify potential intervention, depending on what platform(s) we are optimizing.
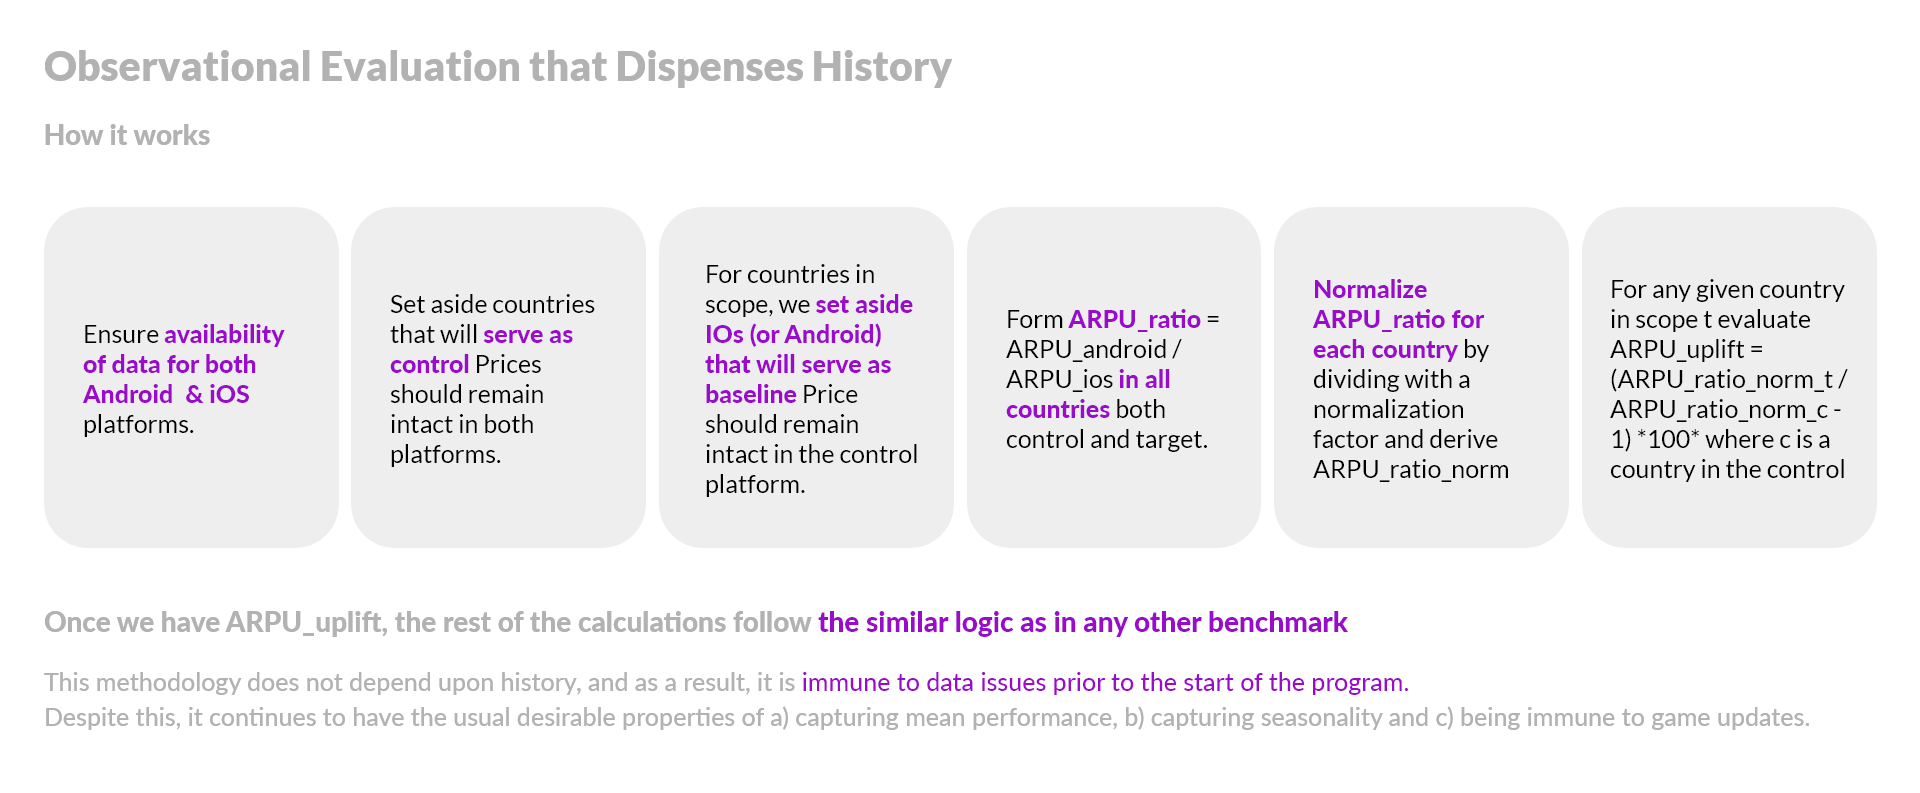
Observational Evaluation that Dispenses History
We have a methodology also in place in case there is a major issue with the historical data. We try to converge to the benchmark by assuming that the scope Countries would have on average the same growth when comparing to iOS with the control Countries. If the scoped Countries perform better against iOS than the control ones, then we attribute this to the optimized prices.
Ensuring high quality results in the GP SDK-Less program
Confidence / Statistical Power in the absence of confidence levels: In the absence of randomized controlled experiments and their respective confidence calculations, we are observing the volume of payers. For the case of very small countries might take several months for user base to reach necessary minimum sample size. We have to ensure a minimum of 25 payers. In the case of Causal Impact, we use the 95% confidence level.
Regarding the auxiliary control countries selection: These should be statistically representative (stable, less skewed in terms of ARPU) of those in the scope of the program. Typically, the countries that are selected as control contribute to less than 10% of total revenue. We choose 5-7 countries or if we have less (but not less than 3) we want to be confident enough in the quality of those.
We remove users who were active only for one day because the likelihood that these users are affected by the pricing program is miniscule. Probably they are bots, or users who downloaded the game by mistake, or found out right away that this is not the game for them. A better engagement filter we apply in other games is based on levels reached, on tutorial completed and so on (but when receiving only activity and transactions data without events this is not feasible).
The wappier pricing program does not affect (at least directly) the inflow of users, this is mainly driven by user acquisition campaigns. What it does increase is ARPU. To calculate the dollar effect of the program each month, we estimate the increase in ARPU attributed to wappier for each country (noted as D(ARPU)) and subsequently multiply with the active users in that country in that month (noted by MAU). i.e., Incremental_Revenue = MAU * D(ARPU).
By removing the users who have no chance of being affected by the program, we decrease MAU in the previous definition, making sure we do not get false credit for a dollar effect for which we are not responsible. Removing these users also increases the accuracy in the calculation of D(ARPU).
We have occasionally experienced tenfold or more increase in MAUs because of store featuring, with simultaneous drawdown in 1d retention. Dropping users who casually or by mistake downloaded the game just because it was featured, we manage to immunize the evaluation against the quality discrepancy between users coming via usual channels and store featuring / user acquisition.
In order to ensure a higher level of confidence on our conclusions we leverage qualitative signals as well. For example, if the control Countries perform 20% better on Android rather than on iOS and in the same month the target Countries perform only 10% better, that means that the wappier prices are not fully optimized. On the contrast, if the performance of control Countries is -30% and the one of scope Countries is -20%, it means that the wappier prices had a positive effect. That is why we may observe countries with a decreasing revenue to have a positive uplift. It is because the growth of the control Countries shows that the decrease would be even higher than the actual one. Given all these assumptions, confidence in results is lower. However, the methodologies that we are using provide an indicator which converges as close to the actual impact as possible. Auxiliary indicators come from the world of qualitative signals.
Calibration period and significant changes
We allow a calibration period: This is similar to a learning phase where the optimization algorithm explores and learns. During the first 3 months, we should not be surprised to observe very positive or even negative results from the program, as users are getting used to the program. Results tend to stabilize around the 3-month mark. It is important that we do not make drastic changes during the first 3 months, on the premise that: Prices have been recently optimized and exchange rate mispricing has also been corrected.
Measurement is an iterative process
As marketing strategies and intervention programs evolve, it is important to continue to re-evaluate measurement methodologies. There is a gap between the academic research into effectiveness measurement and the marketing measurement tools businesses have in their hands. Effectiveness experts need to fill this gap with transparent, open-source research that is robust but also communicated in a way that makes it accessible and digestible for marketers and product managers. When evaluating respective research and applied sciences literature and measurement techniques, we have to focus on multiple signals and evidence-based insights. We have to examine solutions and results not only through a myopic fixed approach but from a holistic, statistically meaningful over time approach.